 abc
abc
abc
Remember that the horizontal axis on a histogram must represent a continuous variable scale such as temperature etc.
Earlier in the course we discussed the breeding success of Little Terns.
If we were interested in the age of the mother birds (a continuous variable) as opposed to the number of eggs laid (a discreet variable), we would use a Histogram. If we were interested in simply counting up the number of eggs laid by many individual birds, then we would produce a bar chart with categories.
Another important feature that we can exploit with these charts is to transform all our 'frequency of occurrence' groups into percentages. Obviously the final 'area under the graph' must add up to 100.
 In the example about seaside resort quality, remember there were 40 resorts
and they were each scored on 8 different attributes (variables). The frequency
table would look like this...
In the example about seaside resort quality, remember there were 40 resorts
and they were each scored on 8 different attributes (variables). The frequency
table would look like this...
|
Class Interval (i.e. final score) |
Number
of Resorts*
|
%
frequency
|
Cumulative % frequency |
|
5-9
|
3
|
7.5
|
7.5
|
|
10-14
|
5
|
12.5
|
20
i.e. (7.5+12.5)
|
|
15-19
|
12
|
30
|
50
i.e. (20+30)
|
|
20-24
|
8
|
20
|
70 i.e. (50+20) etc. |
|
25-29
|
6
|
15
|
85
|
|
30-34
|
4
|
10
|
95
|
|
35-40
|
2
|
5
|
100
|
|
Total
|
40
|
100
|
* This means the actual number of resorts that gained a final score that fell within the given class interval.
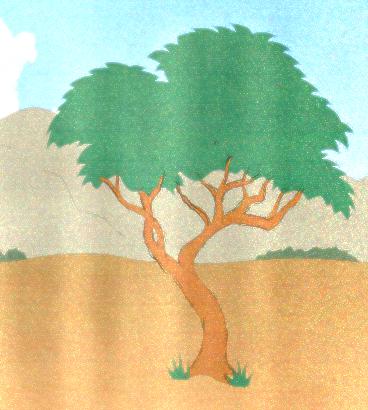 Here
is a data set relating to the approximate age of an African Hardwood species
(Iroko) at the time of felling (1990). 200 trees were assessed. When working
with this set also consider the following.....
Here
is a data set relating to the approximate age of an African Hardwood species
(Iroko) at the time of felling (1990). 200 trees were assessed. When working
with this set also consider the following.....
Q. Could we compare this data set with say, a set from a different forest?
Q. Could we compare this data set with one generated from 1999 data?
and here is the raw data set:
|
Age
@ felling
|
frequency
of occurrence
|
|
<18
|
12
|
|
18
|
14
|
|
19
|
28
|
|
20
|
24
|
|
21
|
33
|
|
22
|
35
|
|
23
|
55
|
|
24
|
41
|
|
25
|
20
|
|
>26
|
13
|
Task: Create your own Histogram (in EXCEL) for a second forest where legislation forbids the felling of any tree (other than diseased ones) until at least 21 years old.
Sample size: 200.
|
21
|
29
|
|
22
|
53
|
|
23
|
59
|
|
24
|
22
|
|
25
|
18
|
|
>26
|
19
|
Q. How does the shape of this Histogram differ from the first one illustrated above?.
Q. Can you discern any other differences in logging policy between the two sites?