 abc
abc
abc
EP
In the Introduction, we tried to explain that handling quantitative data is something that our brains do with great skill all the time. In this unit we will be unravelling some of the of the more formal procedures used when handling valuable scientific data.
We will be asking the fundamental question; why do we need statistics at all? What exactly is the nature of data? The human brain loves patterns and so there is always a desire to identify PATTERNS, TRENDS and RANKS.
Scientific research can take two different lines of approach. One is simply to observe and record what we see, the other is to interfere, that is, we manipulate a situation and observe the effect that this has. Providing we aim to ensure that only one component is altered, we have built a controlled experiment. We can now hope to observe a 'Cause & Effect' relationship.
We will discuss the whole issue of "What is a representative sample (and what is not!)?" Invariably, it is never practical to survey a complete population whether it be people, Hedgehogs, Penguins or the Marsh Fritillary and so it is essential that whatever samples we use are able to mirror the parameters ( at least the ones we are interested in) of the population as a whole. This whole issue of determining how close our results (from working with samples) mirrors the 'real' situation in the whole population is a major branch of statistics called 'probabilistic' testing.
'Qualitative data' suggests that there is no numerical component involved and this may well be the case but for the purposes of any statistical analysis this has to be modified and the way we do that is to use frequencies of occurrence and a process of ranking the results.
Imagine we recorded the hair colour of 60 people. It would be reasonable to construct categories ....brown ....blonde ....black etc. There is nothing inherantly numerical about the word 'blonde' or 'black' but we can change that....
| HAIR COLOUR | FREQUENCY OF OCCURRENCE | % FREQUENCY OF OCCURRENCE |
| BROWN | 24 | 40% |
| BLONDE | 16 | 26.7% |
| BLACK | 20 | 33.3% |
Thus our qualitative data has now become quantitative (to a degree).
Qualitative and Quantitative can be conveniently divided into just 4 categories:
You will need to be comfortable with these categories because the choice of test that can be applied to a data set will be governed by which category your data falls into.
These four scales of measurement are more fully discussed in Level C STEP 1)
There is a further important division to discuss and that is the differences between Parametric and Nonparametric data. Again, this will be covered in STEP1.
Q. Is counting the same as measuring?
A. No!
The visual representation of data is the ideal way of conveying complex results to a wider audience but the process is fraught with potential hazards. It is essential to know what, when and where to use graphics. One particular graphic form; the Histogram introduces the concept of "frequency of occurrence".
Once we can define "how often a given result, reading or event occurs, we can tabulate and display the results graphically. Never underestimate the very real value of a well designed graph of your data.In the early pages of this website, much attention is given to the best ways to display your data in graphical form.
Graphs are also an invaluable precursor to any deeper analysis because they will help you to visualise the data in a way that your brain can more readily accept.
Q. What do we mean by "the average"?
A. There are 3 meanings and all three are correct! More of this in Level C STEP 2
Frequency histograms can be 'smoothed out' if the individual ranges are made narrow enough until we achieve a curve.
Q. What then is a Normal Distribution?
A. Just one particular form of a 'smoothed out' histogram.
The hidden properties of a normal distribution curve are quite remarkable and it is fortunate that in nature, most processes that we wish to observe (in terms of frequency of occurrence) seem to follow this particular type of pattern. Take a look at this Normal Distribution curve and see what preliminary deductions you can make from it.
Q. So if we take a sample from a wider population, can we say that the results we obtain truly reflect what is happening in the wider population?
A. If the variable under investigation demonstrates a frequency of occurrence that follows a normal distribution pattern and our sample size is large enough then we can calculate a confidence level. So (with caution), ..YES we can!
It is very important to remember that it is the characteristics of the whole population we are really interested in and not simply the characteristics of our samples. We are forced to use samples from which we hope to make inferences because it is quite unreasonable to suppose that we can test every member of a given population whether they be people, birds, Corn Marigolds or even milk bottles!
Given a Normal Distribution, it is possible to estimate the likelihood of a particular result (or a new incoming result) lodging at a specific location. Thus we have entered the topic of Confidence levels and limits.
A key strength that statistical analysis can add to many scientific investigations is a formal and consistent value to the probability of something happening by chance. This can be something as trivial as "what is the probability of throwing 3 sixes in a row?" to something far more meaningful such as "What is the probability of a 50 year old man who smokes, contracting lung cancer?" The concept of Probability (of something happening by chance or not) is something that all scientists must be able to work with.
Virtually all statistical tests will involve calculating a test statistic. This value is usually compared to a table value at a certain level of probability (conventionally 95%). This gives us a way to measure the validity or truth that our results and conclusions are a fair approximation (or not) to what has really happened. We may be trying to answer a specific question such as "How confident are we that by calculating the means of two samples that they came from the same population?
A key concept to grapple with now is Randomness...Has the result obtained just happened 'out of the blue' i.e. by chance or is it because of the alternative possibility i.e. cause and effect? This area of thought is known as Hypothesis testing. Depending upon the specific circumstances of an experiment, we talk about the Null Hypothesis: Ho. Depending upon the circumstances this may mean "NO RELATIONSHIP" or "COMPLETE RANDOMNESS" or "NO DIFFERENCE" and we must have an alternative hypothesis, the so called H1 hypothesis, to indicate that there is a relationship. Again, we will set critical points (critical values) and test whether our test values fall above or below those critical values and that will determine which of the two opposing hypotheses we have to accept.
We always begin with a Null hypothesis and not the other way around. So we always start by assuming there is 'no difference'and our task is to attempt to disprove the Null hypothesis.
Suppose now that we have two sets of data instead of one. We may wish to compare the attributes and make inferences about the reasons for their similarities and differences..
 Suppose
there is a colony of Little Terns breeding on Chesil Beach and another colony
breeding on a beach near Cromer in Norfolk. The two colonies may differ considerably
in both size, behaviour, food supply, loss to predators, migration habits and
chick survival. With care however, it is possible to make reliable comparisons
concerning say chick survival. This could be vital. Suppose that the Cromer
colony shows a chick survival rate of 60% whilst the comparable figure for Chesil
is only 30%. Analysis of factors such as food supply or loss to predators may
help the wardens at Chesil to improve their management strategies and ultimately
the survival rate, to the long term benefit of the colony.
Suppose
there is a colony of Little Terns breeding on Chesil Beach and another colony
breeding on a beach near Cromer in Norfolk. The two colonies may differ considerably
in both size, behaviour, food supply, loss to predators, migration habits and
chick survival. With care however, it is possible to make reliable comparisons
concerning say chick survival. This could be vital. Suppose that the Cromer
colony shows a chick survival rate of 60% whilst the comparable figure for Chesil
is only 30%. Analysis of factors such as food supply or loss to predators may
help the wardens at Chesil to improve their management strategies and ultimately
the survival rate, to the long term benefit of the colony.
Depending upon whether the data from our samples is ordinal or on a higher scale (e.g. ratio) and whether it is paired or not, there are many tests we can perform to identify differences (in central tendency) and / or relationships between two sets of results e.g. the Paired t-test and the Mann-Whitney U-test.
We will also look at ways of comparing distributions.
In some cases it is possible to say "What results would we expect to obtain and what results did we actually obtain? and "are the results obtained significantly different from what we expected? The often quoted 'Chi Squared' test fits into this category.
The next topic looks at the strength or closeness of the relationship between two variables. This means "the degree of Correlation between 'x' and 'y' "
"If the value of 'x' changes, what happens to 'y' and if we have a new value for 'x', can we accurately predict 'y' (and vice versa).
These are some of the questions that Correlation might help to answer...
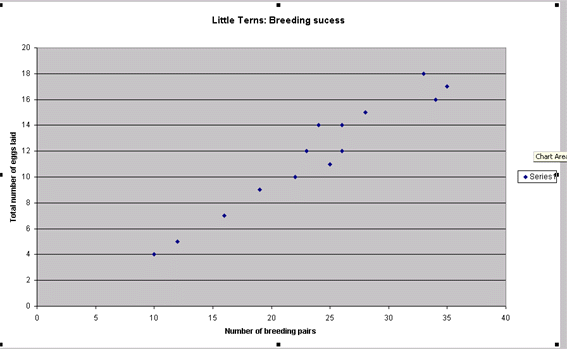
Q. Does the level of breeding success increase as the colony size increases?
Q. How strong is the relationship between colony size and breeding success?
Q. If the breeding pairs increased to 60, how many eggs might we reasonably expect to see?
We may wish to put forward a hypothesis on the matter...
"Breeding success depends upon colony size"
and the corresponding Null hypothesis would be...
"There is no relationship between colony size and breeding success.
"It is possible to carry out correlation tests on Ordinal data (Spearman's test) and another test (Pearson's) on Interval / Ratio data to measure the strength of the relationship and to estimate which of these two statements is most likely to reflect the truth and the level of confidence we have in our findings.
So correlation is the last topic to study in Level C
END OF LEVEL C Overview.